Nodes
Services, agent steps, tools, road segments, sensors, proteins, metabolites, reactants.
Sheaft
Sheaft turns telemetry, execution traces, topology and domain constraints into a live reliability model, stress-tests disruption scenarios, and shows which critical operations or agent workflows are fragile before failures propagate.
Built for graph-structured systems: software infrastructure, agent harnesses, smart mobility, and scientific reaction or interaction networks.
Sheaft represents a system as an attributed graph: nodes, edges, constraints, telemetry, execution traces, stressors and critical operations. The domain changes; the resilience question stays the same: what breaks, how far it propagates, and which operations or workflows are affected.
Services, agent steps, tools, road segments, sensors, proteins, metabolites, reactants.
Calls, tool invocations, state reads/writes, flows, roads, reactions, interactions.
Latency, capacity, confidence, permission state, retrieval age, energy, rate, state.
Domain contracts, policy checks, evaluator gates, signal rules, conservation laws, biological priors.
Crashes, tool timeouts, schema drift, stale retrieval, missing observations, perturbations.
Fragile paths, blast radius, affected operations or workflows, green/yellow/red posture.
Procrustes checks whether the available static evidence is sufficient. Bering discovers the runtime graph. Sheaft evaluates disruption scenarios and produces resilience verdicts.
Procrustes checks deployment, tracing and reproducible-operation artifacts and prepares a conservative collection plan for Bering.
Bering ingests telemetry, topology files, execution traces, event streams or explicit graph descriptions and builds a typed system model.
Critical operations, constraints and success predicates are attached to the graph: service journeys, agent workflows, corridor operations, reaction routes or biological pathways.
Sheaft simulates failures, missing observations, degraded components, tool timeouts, schema drift, stale retrieval, demand spikes or perturbations without breaking the real system.
The result is a graph-level report: fragile components, affected operations, blast radius, posture trend and recommended validation targets.
Sheaft evaluates resilience of software systems before release and between releases. It builds service graphs from trace data or topology artifacts, simulates dependency failures, and returns a gate or posture verdict for critical user journeys.
Digital infrastructure is graph-structured operational infrastructure. Services, APIs, queues, databases, replicas, release policies and user operations form one dependency graph. Validation evidence
Sheaft builds a reliability model from agent harness execution traces: LLM calls, tools, retrieval, memory, policy checks, evaluators, permissions, retries, fallback paths and human gates.
Single-run task success and average pass rate miss boundary failures. Real incidents appear between the model, tools, retrieval, state, guardrails and release gates. OpenTelemetry GenAI conventionsAgent spans
Sheaft evaluates resilience of smart mobility infrastructure represented as a live attributed graph: road segments, intersections, toll gates, sensors, signal controllers, payment systems and operations centers.
Smart mobility is cyber-physical infrastructure. Road networks, tolling, sensors and digital services form one distributed operational graph. NIST CPS contextSUMO road graph
Sheaft analyzes chemical reaction networks, biological interaction networks, metabolic pathways and bioprocess graphs to find fragile routes, critical intermediates, observation gaps and perturbation-sensitive modules.
These systems are routinely modeled as graphs: reactions connect reactants, intermediates and products; biological networks connect proteins, genes, metabolites and signaling interactions. EMBL-EBI biological networksRSC reaction networks
Sheaft evaluates inbound, storage, replenishment, picking, packing and shipping as one operational graph and tests how congestion, equipment outages or demand spikes affect order fulfilment.
Locations, routes, buffers, equipment, inventory and order waves form a changing dependency network rather than a set of isolated warehouse KPIs. GS1 EPCIS visibility events
Sheaft represents production plans as a graph of jobs, operations, materials, equipment, personnel and precedence constraints, then evaluates plan robustness under delays, shortages, changeovers and asset downtime.
A feasible plan can still be fragile: one late material, unavailable machine or quality hold may propagate across orders and delivery commitments. ISA-95 operations modelNIST digital twins
Procrustes checks whether deployment, tracing and reproducible-operation artifacts provide enough static evidence for Bering to attempt an operation-specific, replica-aware runtime model.
Bering builds typed graph artifacts from telemetry, topology inputs, execution traces, event streams or explicit domain models. It publishes stable model and snapshot artifacts for downstream resilience analysis.
Sheaft consumes graph artifacts, stress-tests disruption scenarios, evaluates domain policies and tracks resilience posture or release verdicts over time.
Model Discovery and Graph Simulation was recognized in ICSE 2026 NIER with a Distinguished Paper Award.
Official ICSE pageGraph-discovered resilience models were evaluated against live fault-injection outcomes on a distributed benchmark.
OpenTelemetry is forming GenAI, agent and tool-span semantics, which makes trace-derived reliability models a portable research abstraction rather than a local log format.
GenAI conventions Agent spansBering and Sheaft are available as public tools for graph discovery, simulation, verdicts and posture monitoring.
GitHubSheaft can turn passive telemetry and execution traces into an explicit model and produce useful resilience signals without running broad live experiments every time.
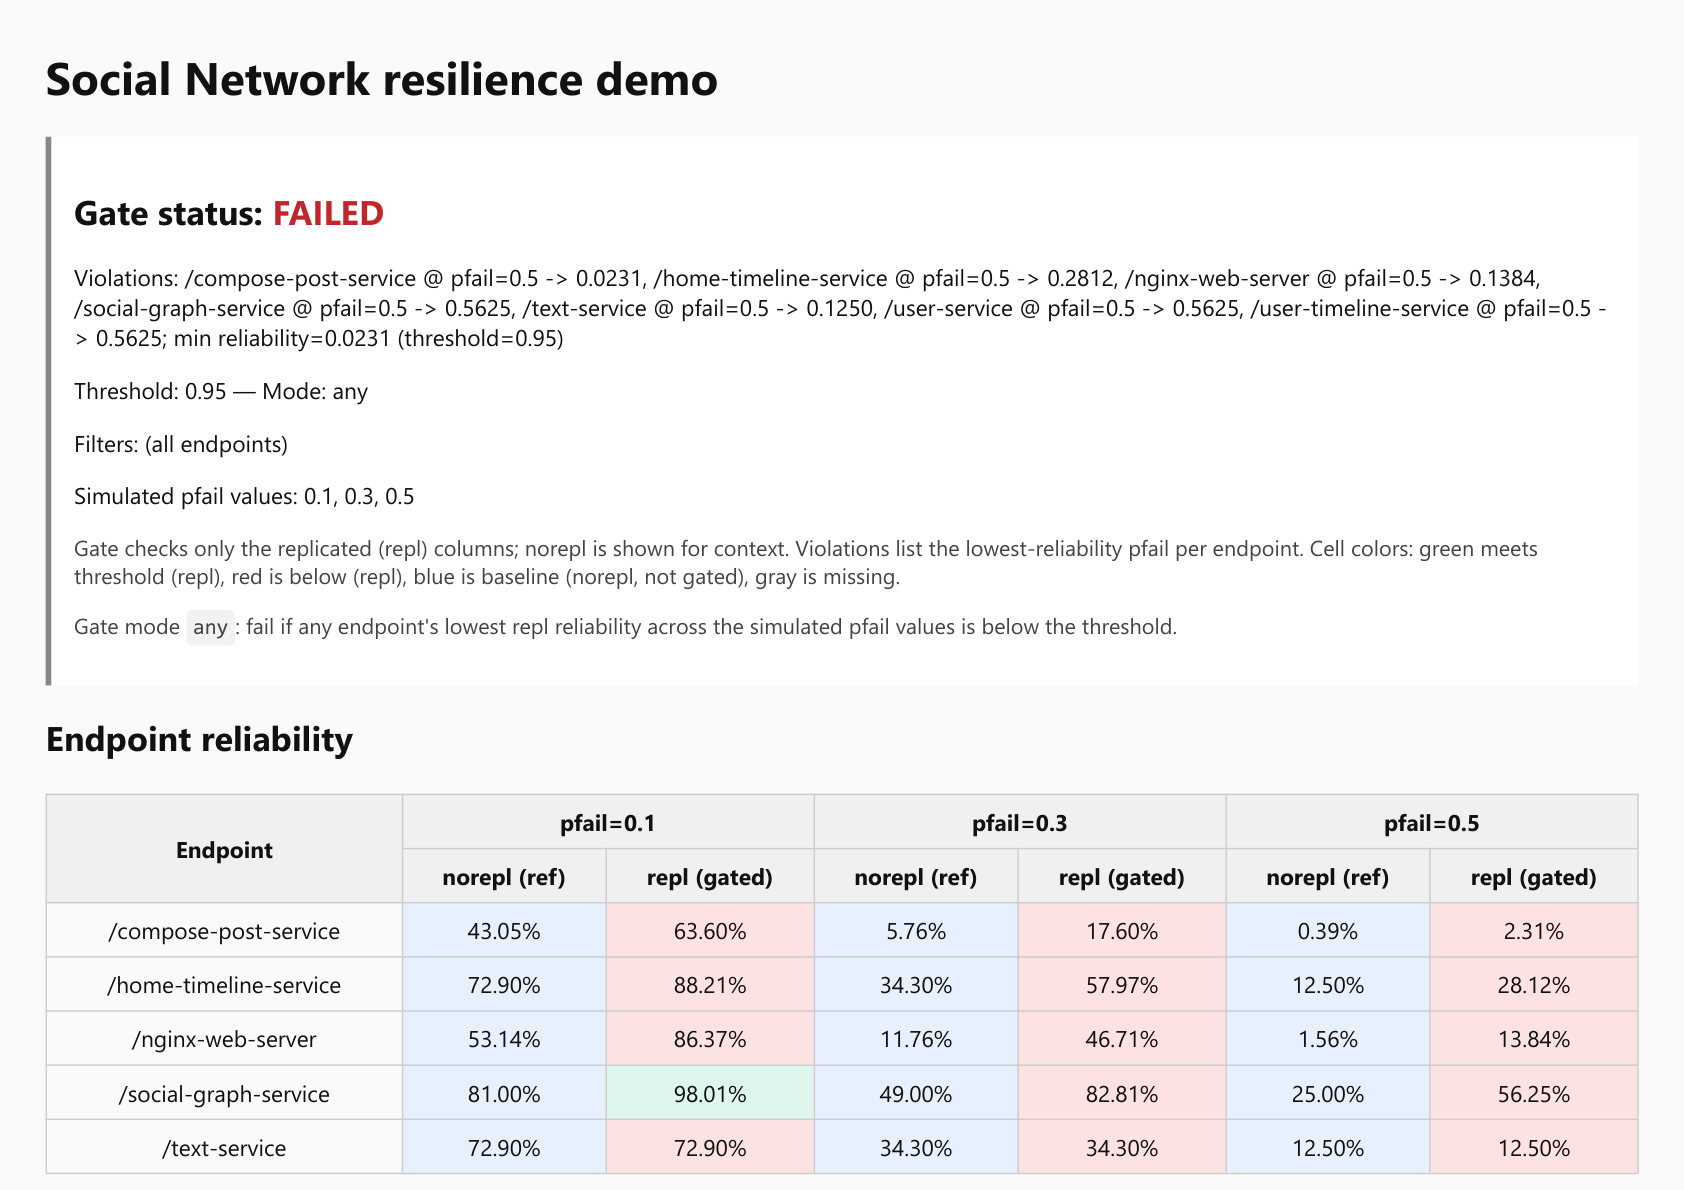
The current public report shows the most mature software-infrastructure workflow. The same report pattern extends to agent harnesses, mobility and scientific-network pilots.
Corridor graph, missing observations, affected mobility journeys, disruption propagation.
Reaction/pathway graph, critical intermediates, perturbation-sensitive modules, alternative routes.
Trace-derived call graph, stale retrieval, tool timeout, schema drift, permission denial, release verdict.
Flow graph, bottlenecks, congestion propagation, at-risk orders, recovery paths.
Job graph, critical constraints, delay propagation, affected commitments, replanning priorities.
Start from trace data, topology and incident history for one service domain. Sheaft builds a model, runs failure scenarios, and compares the result with known incidents or release risks.
Start from one agent workflow and one set of historical execution traces. Sheaft builds the harness reliability graph, simulates virtual chaos scenarios, and returns a green/yellow/red release verdict.
Use topology and telemetry from one corridor, tolling domain, parking/payment flow or sensorized mobility area. Sheaft identifies fragile components, missing observations and affected mobility journeys.
Use a reaction network, biological interaction graph or pathway model with perturbation scenarios. Sheaft identifies critical intermediates, fragile modules and robustness hypotheses.
Start with one warehouse zone, one order flow and a representative historical period. Sheaft identifies bottlenecks, propagation paths and recovery options against actual fulfilment outcomes.
Start with one production plan, its resource and material constraints, and execution history. Sheaft stress-tests delays and outages and ranks the commitments and replanning actions at risk.
Sheaft is grounded in model discovery, graph simulation, sheaf-theoretic consistency, causal emergence and resilience monitoring. The product packages these ideas into practical workflows for networked and agent systems.
 Открыть в полном размере
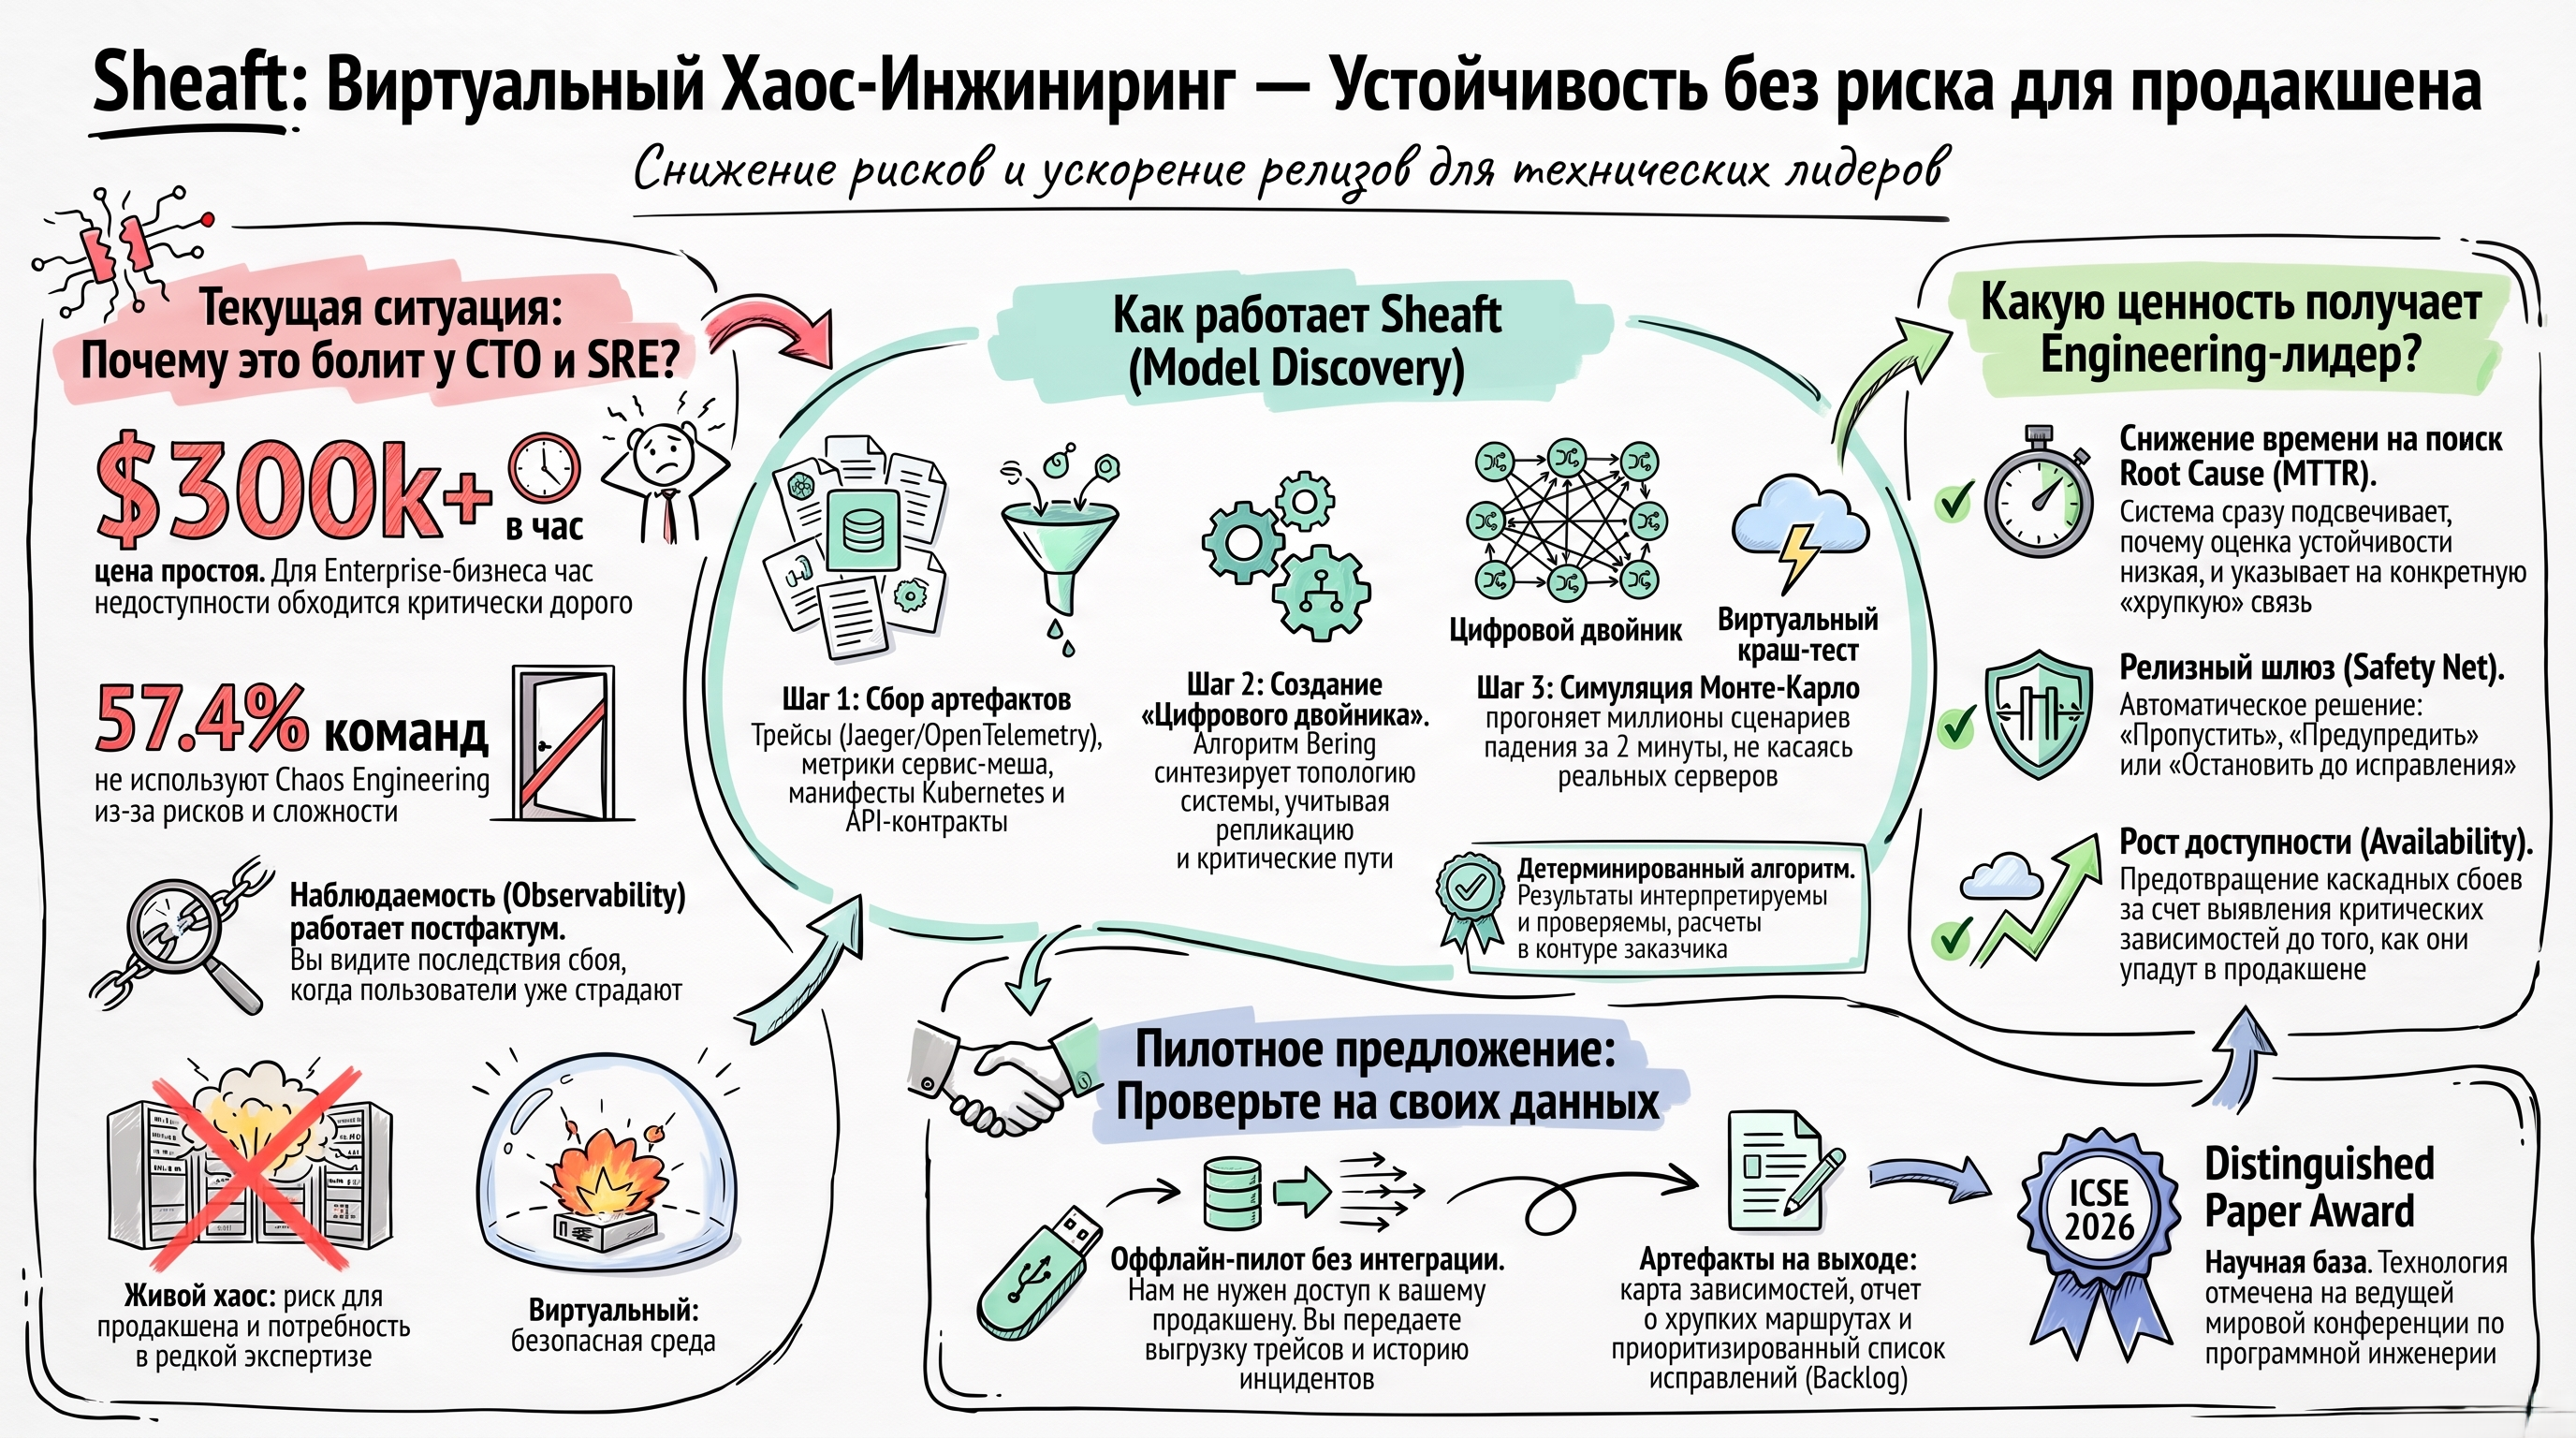
Подробнее о продукте, сценариях применения и пилотном проекте.
Скачать полную презентациюPDF · 10 слайдов · 1,9 МБ
 Open full-size image
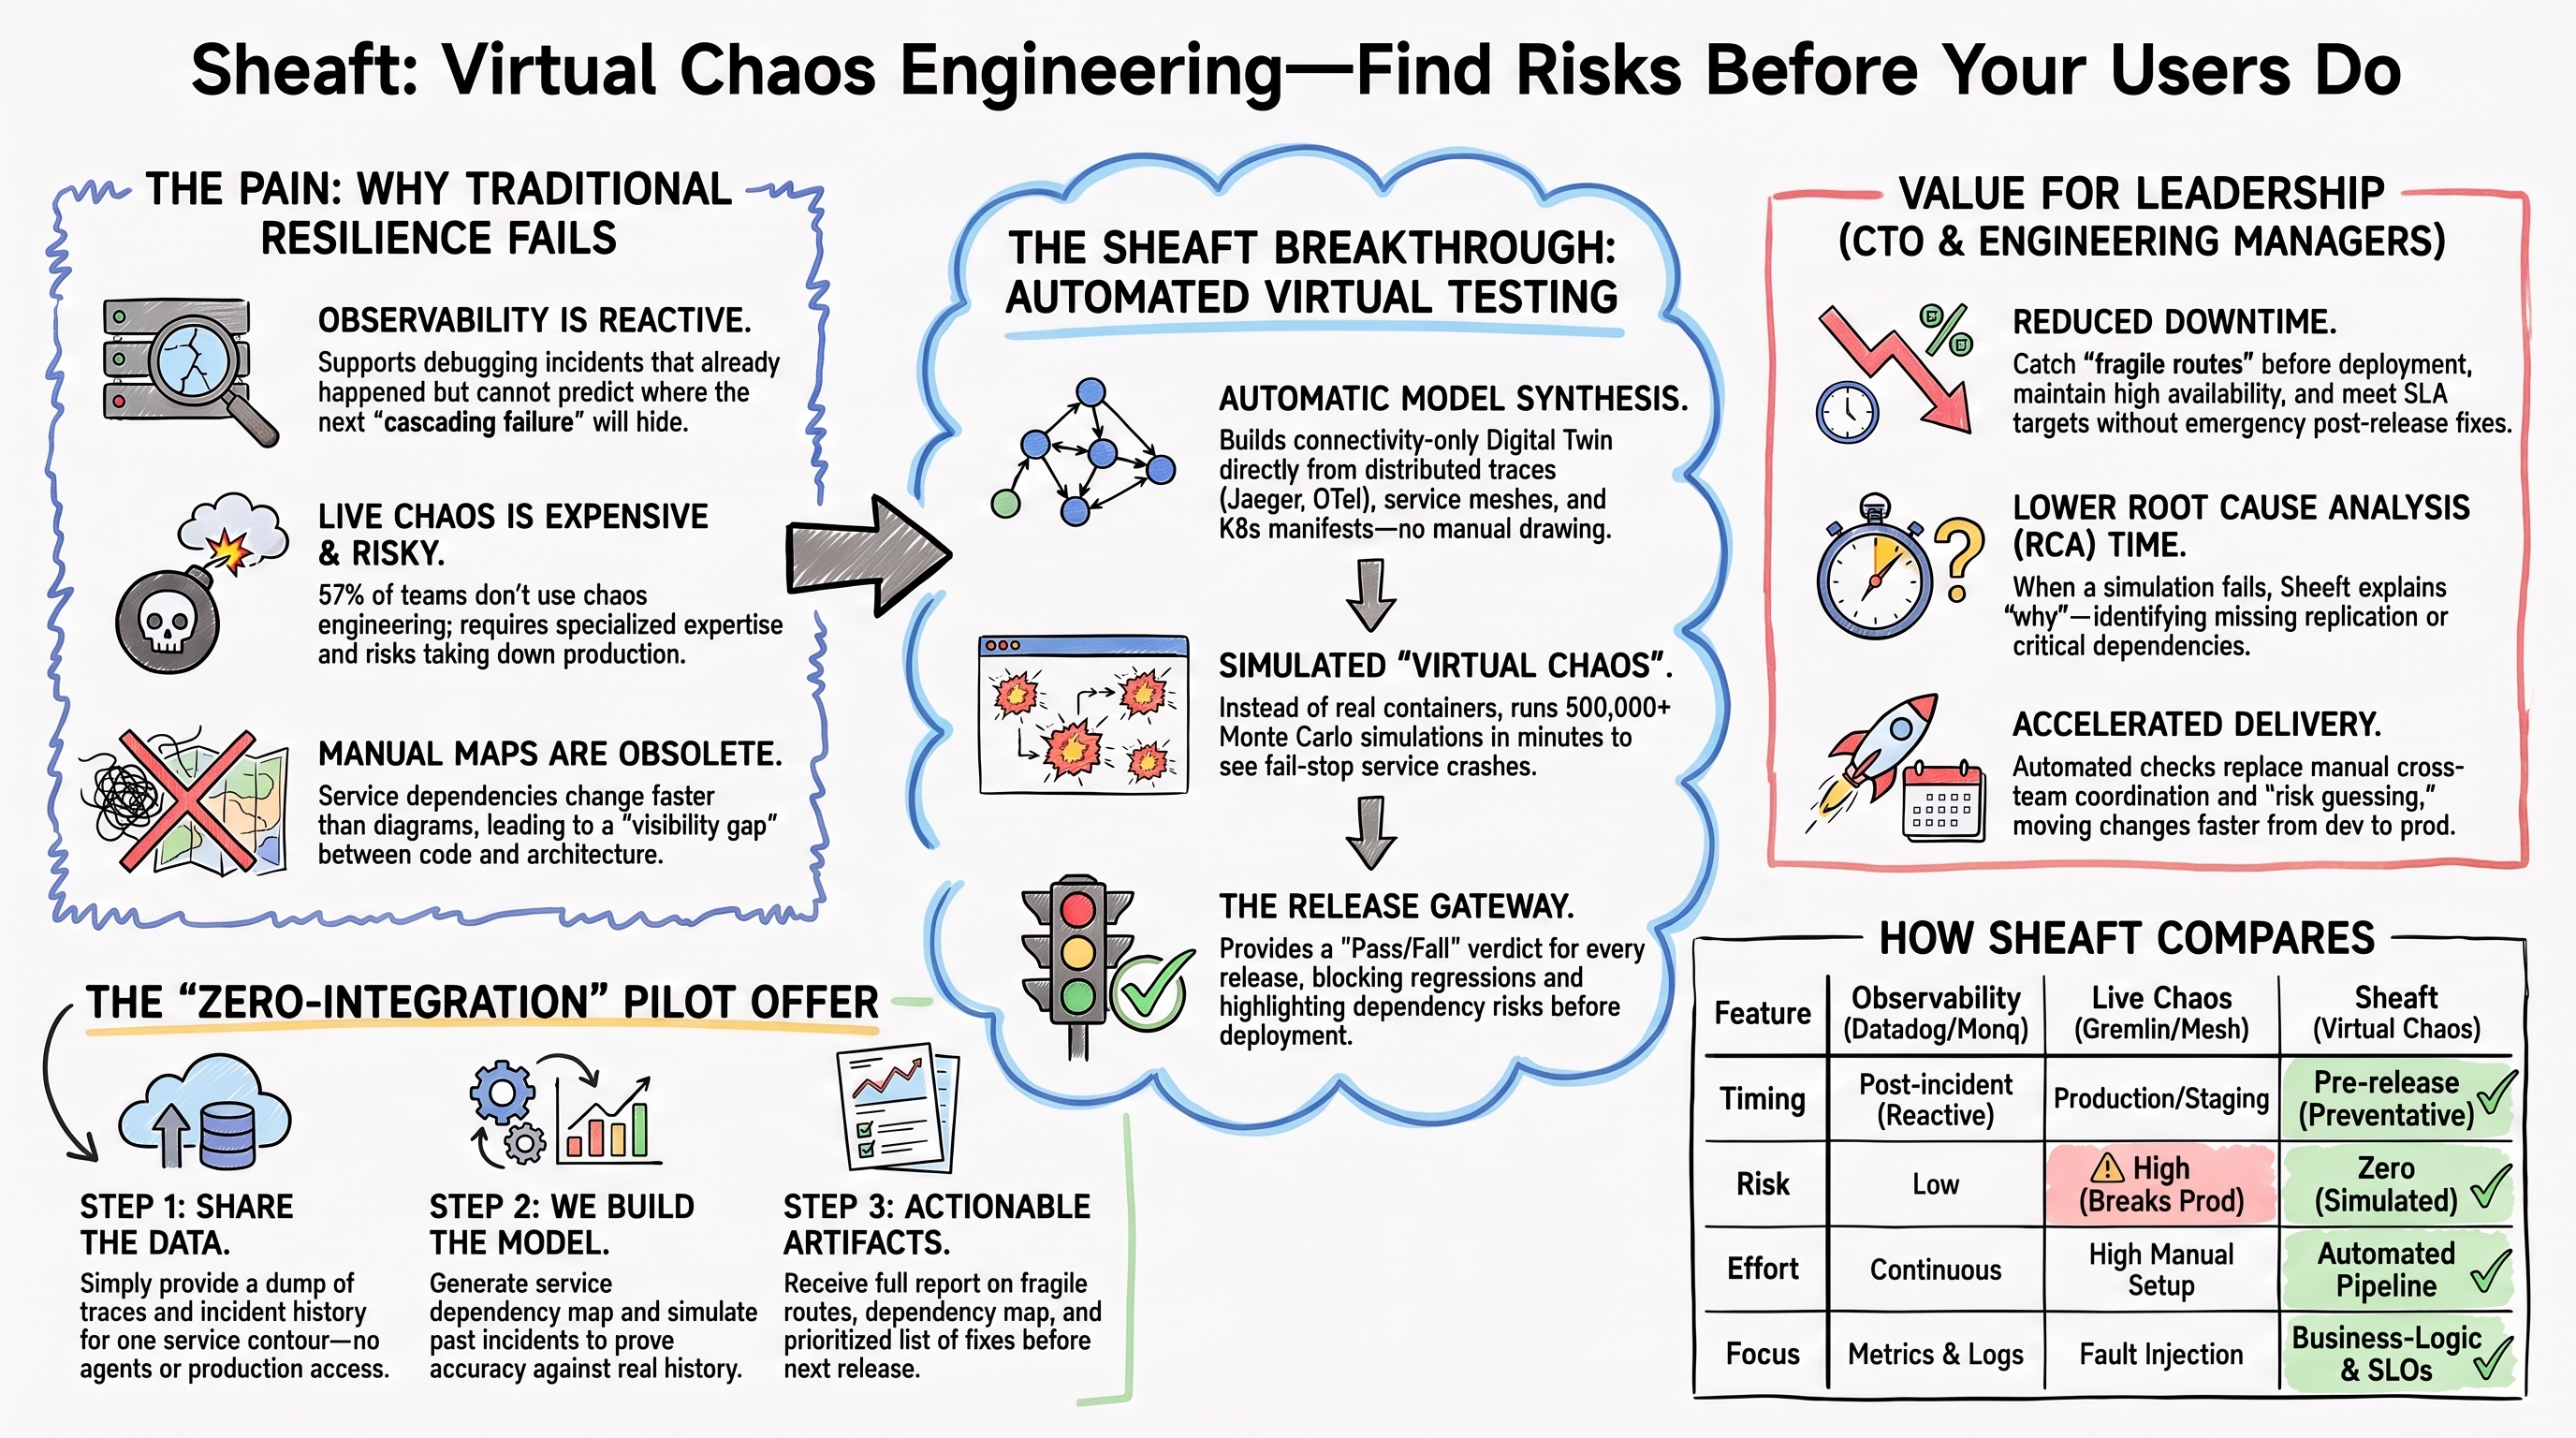
Explore the product, use cases, and pilot project in more detail.
Download full presentationPDF · 9 slides · 1.4 MB